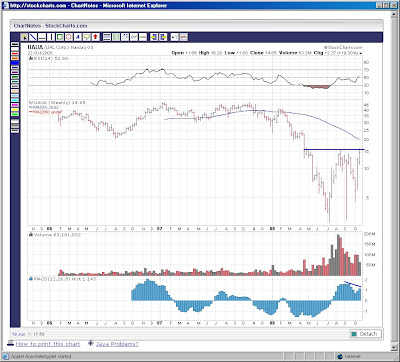
If markets don't like uncertainty, then a correction is in the cards until November 4th, election day...
tb
A few charts of interest...10/29/2008...
10/28/2008...Market up 10%..
Great move today...Time to look at charts that consolidated during the sell-off these past few weeks... I think AAPL is showing strength here, and during the sesonal trend, should move higher over next several months...tb
Bllomberg article...
Valuation Watch
The S&P 500 was valued at 10.7 times estimated profit when trading opened today, the cheapest compared with the multiple using trailing profit since at least 1995. The index was also 25 percent below its average closing price over the last 50 days, a level reached only four previous times, spurring average gains of about 20 percent over the next six months.
The Dow’s only larger point gain was on Oct. 13, when the 30-stock gauge jumped 936 points on the government’s plan to buy stakes in banks.
More than nine stocks rose for each that fell on the New York Stock Exchange, where trading volume of 1.7 billion shares was 18 percent greater than the three-month daily average.
Equities around the world tumbled this month, wiping out more than $12 trillion of market value before today, after money markets froze, banks’ credit losses climbed to almost $678 billion and economic growth weakened. The S&P 500, which dropped 3.2 percent yesterday, trimmed its monthly decline to 20 percent today.
Citigroup 14 percent to $13.41 and Bank of America rose 12 percent to $23.02. The S&P 500 Financials Index jumped 13 percent, the gauge’s best advance since September.
Fed Bets
The Fed will announce its decision on interest rates tomorrow. Futures trading suggests a 38 percent chance the central bank will cut the benchmark rate by three-quarters of a percentage point, to 0.75 percent. By contrast, only one of 64 economists foresees that outcome, according to a Bloomberg survey. The rest of the Fed funds futures bets point to a half- point cut.
Alcoa added $1.74 to $10.78. The stock dropped 71 percent this year, leaving it valued at 4.86 times earnings as of yesterday, the cheapest on record.
“Anyone who has a long-term view and looks at earnings multiples and inflation will say it’s a cheap moment to buy stocks,” said Linda Duessel, equity market strategist at Pittsburgh-based Federated Investors Inc., which manages more than $333 billion.
Commercial Paper
GE rose $1.76, or 9.9 percent, to $19.49. The Fed started buying commercial paper yesterday, when companies sold 1,511 longer-term issues totaling a record $67.1 billion of debt due in more than 80 days, compared with a daily average of 340 issues valued at $6.7 billion last week, according to Fed data. The central bank probably absorbed about $60 billion of the total, said Adolfo Laurenti, a senior economist at Mesirow Financial Inc.
Exxon Mobil Corp. advanced $8.77, or 13 percent, to $74.86. Chevron Corp. climbed 13 percent to $70.02. Energy shares in the S&P 500 jumped 12 percent as a group.
Morgan Stanley boosted holdings of Exxon and AT&T Inc. in its U.S. model portfolio, citing the “defensive” qualities of the shares.
Exxon had its position doubled to 4 percent because the world’s biggest energy company is likely to be “a far better than average performer” if some stability returns to the markets, according to analyst Douglas Cohen. AT&T’s position was increased to 3 percent from 2 percent. Shares of the largest U.S. phone company rose 13 percent to $27.61...
...Treasury’s ‘TARP’
The Treasury is buying equity stakes in banks as a way to inject capital into the struggling financial system. Nine of the nation’s biggest banks may receive $125 billion from the $700 billion Troubled Asset Relief Program as soon as this week, and a growing number of regional lenders have announced preliminary approval to take part in the program.
The Treasury also will use the TARP to acquire illiquid mortgage-related assets from a range of financial institutions to make more room on their balance sheet. This effort is moving more slowly as the Treasury selects asset managers to run the debt- buying effort.
Japan’s Nikkei 225 Stock Average today rallied from a 26- year low to gain 6.4 percent, while Hong Kong’s Hang Seng Index recouped yesterday’s 13 percent plunge. The MSCI Asia Pacific Index added 3.4 percent, while Europe’s Dow Jones Stoxx 600 Index climbed 2.3 percent.
"A picture is worth a thousand words". This site posts charts of interest, and repeatable chart pattern's that will make you a better trader and hopefully return you some extra cash.
10.28.2008
10.27.2008
10.26.2008
10.25.2008
Irrational Exubuerance - QQQQ's
10.22.2008
USO, Dollar and an airline stock..
10.21.2008
10.20.2008
SNL Skit...
Too funny for me, had to post it...
tb
PS- Was that Tim Knight on his snow machine? Looks like him anyway... :)
10.19.2008
10.17.2008
10.16.2008
I'm slipp'n...
GOOG price low today was at 11 EST (~310), not my projected low at 3:45pm EST of (300). And from the low, its up 20% in after hours to $387....That's almost 80 pts!
I missed it...
tb
I missed it...
tb
10.15.2008
GOOG reports AH thursday...
10.14.2008
S&P 500 Chart
10.13.2008
10.12.2008
10.10.2008
Next week: Options week
Two weeks ago I reflected on this past years market behavior during options week, and while I could have never anticipated this type of a fall, I was anticipating some flat to down movement in the markets before options week. My theory from prior options month's, is that whatever has been the general trend for the past several weeks in the market (or a given sector), will reverse direction in a big way, during options week.
Why did I sell my AAPL Oct 100 puts, which I paid 0.55, for $2.35!
Why did I sell my OCT X 120 puts in august, when they have EXPLODED to over $60 (from a $1 purchase back in June)!
Man, I called that GOOG short, anticipating that $400 would not hold, but I completely missed the opportunity to buy the OCT 300 puts when they were cheap..
Ok, Ok, I digress...That said, next week is options week, and I believe that next week, stocks will appear to be "cheap", and buyers will move in, and prices will move up 30-40% during the week. It's possible that it may all happen on a single day, like next friday, but, I believe there will be opportunities to buy OCT call options that will move from a nickle to $10 even $20 bucks.
Fortunes have already been made for those who have been short...If you flip the market charts upside down, you see a market going straight up, so I think you would be foolish to keep holding your position, knowing a snap-back reaction is near.
Possible market movers..
INTC reports after close on Tue.
GOOG reports on Thur.
WFC reports on Wed.
C reports on Thur.
tb
PS-This strategy is not for everyone...your call options can go to $0.
10.08.2008
The 200 weekly moving average trade...
I use the weekly charts to spot trends... You will not see this on a daily chart, but the 200 weekly moving average has showed up on many charts as a short term bottom...So, here is the short-term trade.. First, stay short until the stock price hits the 200 weekly moving average.. Once the stock price hits the 200ma exit the short...Next, look at going long on the bounce at the 200ma, when with a tight stop.
Market is burning up...
Forget charts, just look at flash cards....This market is burning up....lol...
10.06.2008
The weekly tail of the VIX...
10.05.2008
10.04.2008
Why did the VIX cross the road?
Answer: to get to the other side!
Ok, bad joke.. these times are tough if you are a bull...
Here are a couple of charts to show where we are at today...
Like I said, it's tought to be a bull, you have to pick your spots... we did not get the snap-back rally I hoped for, so I don't know what else will move it higher, other than we are 'oversold'.
I have X OCT 110 calls that are worthless, PFE JAN calls that are up 100%, and NCC OCT calls that are up 100%...
tb
10.01.2008
Subscribe to:
Posts (Atom)