Click here
tb
PS- Happy New Year!
"A picture is worth a thousand words". This site posts charts of interest, and repeatable chart pattern's that will make you a better trader and hopefully return you some extra cash.
12.29.2010
12.15.2010
Volatility...
Expect the unexpected... I don't know when, but the chart patterns says we are close to some major volatility...
tb
12.01.2010
AMZN - Deja Vu?
If last year is any indication, then AMZN's stock price should head lower over the next few months.. Looks like AMZN is a better buy at $150..
(Also, AMZN did not respond to the rally today).
tb
11.24.2010
...with Thanksgiving...
It's time to reflect...
In 1621, the Plymouth colonists and Wampanoag Indians shared an autumn harvest feast that is acknowledged today as one of the first Thanksgiving celebrations in the colonies. For more than two centuries, days of thanksgiving were celebrated by individual colonies and states. It wasn't until 1863, in the midst of the Civil War, that President Abraham Lincoln proclaimed a national Thanksgiving Day to be held each November. Thanksgiving was proclaimed by every president after Lincoln, and in 1941, Thanksgiving was finally sanctioned by Congress as a legal holiday, as the fourth Thursday in November.
We all have a great deal to be thankful for – our health, family, friends. This is one of those weeks where we can focus more on the family and friends side of the work/life balance equation.
tb
11.20.2010
Lump of coal trade...
I posted 15 days ago about ACI.. but, the stock continued to run to 30ish after my post, so I sat on the sides and watched... The past few weeks, both the INDU pulled back to 11,000, and ACI pulled back to 27.50. Perfect support area to buy in, so I did. Now the stock price is at all time highs (in the past 2 years). I like it.
tb
tb
11.13.2010
11.04.2010
10.29.2010
10.27.2010
10.26.2010
10.20.2010
Market tipped it's hand...
I believe the market selloff on monday, 10/18/2010, was a clue to whats ahead. Now, all bears celebrated this move, with new short trades..
BUT, today, 10/20/2010, the market is up, or "fading" the pullback from Monday. That is good news for bears, as I think, the way to play this market right here, is to sit and watch the market over the next few days. You can start accumulating hedges..I expect the market to run flat, followed by an increase in selling pressure..
Not sure what to buy?
VXX
QID
UUP
ERY
SDS
TWM
just to name a few...
let's see what happens..
tb
10.15.2010
GOOG!
Flat price, double bottom, MACD rising, cross zero line, KaChing!
Nice price action in GOOG.
$100 invested in Oct $490 call Options returned over 1000% in 1 day. Nice!
tb
PS- If in GOOG, I would take profits here. Until $600 is left behind, I would sit on the side.
10.10.2010
10.08.2010
9.29.2010
TBT Chart...
There is another blog which posted a chart of TBT.. And the blogger thinks the TBT chart is bearish... I was expecting to see the same thing, but after reviewing, the weekly chart gives a different perspective..
Let's see..
tb
9.25.2010
DOW Chart...
- The last 3% of a move in the market usually moves the fastest
- Stocks at 52 week highs will move higher near end of Qtr, due to window dressing
- We have been range bound from 9800 to 11k
- The 200 weekly MA acts as resistance, we are approaching that MA here
- Historical bearish October month nearing
Window dressing, easiest time to trade, find 52 weeks high stocks and buy them for quick profits. End of market move moves the fastest, so as we continue higher, just adds to confirmation of move.
Bearish case:
We are approaching top end of range, and end of september, which means, the worst month for bulls is right around the corner. Until the market tells you otherwise, assume selloff from 11k.
Conspiracy Theorist case:
We don't sell off in October, but do pullback 2% quickly, to get traders to jump on the bearish bandwagon, and then proceed higher to 12k, before we selloff sometime near the end of October.
tb
9.20.2010
9.19.2010
Bullish pattern developed with ORCL...
ORCL developed the same pattern as BLK, mentioned weeks ago..
let me know if you see other stocks that have a similar pattern..
tb
9.04.2010
SPY @ Resistance
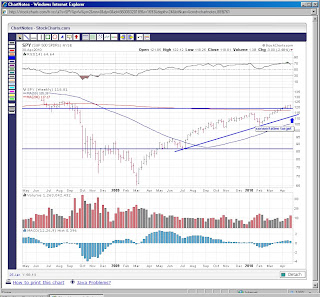
I had a nice week, with picks of JOYG and BLK.. in fact, anyone who was long the market did well this past week. But, as mentioned, the market is at resistance here. Great time to tighten stops, take profits, start hedges, go short, etc. SPY above 114, and the market breaks the down trend line, and heads higher.
tb
9.01.2010
8.30.2010
BLK Chart...
I ran across this stock's chart, and I like the pattern being formed. This is a low risk entry right here...
tb
8.28.2010
SPY Forcast...Cloudy with a 50% chance of rain...
Right now, the market "weather" looks like sunny in the near term forecast, but, long term, I think we will see dark clouds forming, followed by rain, and maybe even some hail...
In other words, go long here with cautious optimism... if this holds true, be ready to exit longs, and/or start hedges around 110ish..
tb
8.23.2010
Leaders lag...
Leaders lag the market to the downside... Most stocks have corrected some, but consider AAPL, which has been "consolidating" for the past several months.. or has it? The stock price is flat, but the MACD shows that something omnious is about to happen... MACD is a leading indicator, and with flat price, and falling MACD, you have bearish divergence...
Watch $240...
tb
8.09.2010
6.07.2010
5.27.2010
5.25.2010
5.20.2010
5.18.2010
A daily dose...
If you trade daily, love the excitement of picking the top and bottom for the day, have at it!
Generate 100's of trades per week, scalp points... quick like a bunny... live for the thrill!
But, if you don't step back, and look at the big picture, you will see a bigger move is unfolding....all you need is one thing....patience.... try slowing the trades down....focus on the bigger time frame.... and you might just find that you're more profitable...
tb
5.14.2010
FIFO
you know the expression - "first in, first out".
Technology has been on a run! ...first out of the gate, higher... but, that also holds true when there is a correction lower..
tb
Technology has been on a run! ...first out of the gate, higher... but, that also holds true when there is a correction lower..
tb
5.10.2010
5.01.2010
The warning signs are now visible...
With Bonds on the rise, Volatility on the rise, and S&P on the correction, the signs are there...the market is going to pullback... sell the rallies.
tb
4.30.2010
4.23.2010
4.18.2010
4.14.2010
FSLR - "Fire sale"
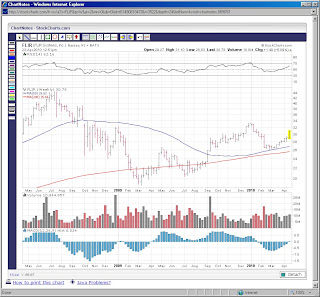
Long term trend line is finally broken..I think after the last test of 100, you have your support price.
tb
4.07.2010
4.06.2010
4.05.2010
TLT Chart...
TLT looks like it wants to test the support levels, which is good for equities...
tb
PS - one point to make, from this past year...
It is better to trade in the direction of the market, than to be the first to capture the trade in the other direction.
4.04.2010
4.03.2010
4.02.2010
3.31.2010
The good, the bad, and the ugly...
I want to take a minute to pause and reflect on this past year... I have posted some fantastic trades, and some, well, not so fantastic...so, below is my personal scorecard...
In feb, 2009 I suggested a bottom in BAC. Because the bottom was 2 weeks later on March 1st, 2009, I give myself an "A" grade.
In March, 2009, I suggest looking into the Solar Index. In the past year, that WAS the bottom at $6. I give myself an "A" grade.
In April, 2009, I suggested taking quick profits in Retail. We know that sector has been on a run like no other for the past 12 months. Grade "D-".
In May, 2009, I saw a bottom forming in UNG. Well, if you have looked at UNG at all in the past 6 months, you will know the story. UNG was a widow maker. I give myself an "F" grade.
In September, 2009, I saw the LVS volume up more than normal, in addition to a bearish chart pattern formation, so I suggested taking profits. Today, months later, the price pattern has been flat, taking profits was the prudent thing to do. I give myself a "B" grade.
And finally, in December 2008, I posted a bottoming chart pattern in BIDU. The stock has been on an amazing run. If you held it this past year, you are up over 700%. That an "A+" grade.
tb
3.26.2010
3.25.2010
3.23.2010
3.22.2010
3.18.2010
3.17.2010
3.05.2010
3.01.2010
2.23.2010
Subscribe to:
Comments (Atom)


