"A picture is worth a thousand words". This site posts charts of interest, and repeatable chart pattern's that will make you a better trader and hopefully return you some extra cash.
4.30.2010
4.23.2010
4.18.2010
4.14.2010
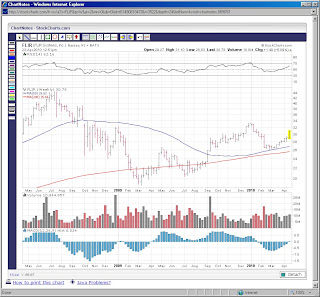
FSLR - "Fire sale"
Long term trend line is finally broken..I think after the last test of 100, you have your support price.
tb
4.07.2010
4.06.2010
4.05.2010
TLT Chart...
TLT looks like it wants to test the support levels, which is good for equities...
tb
PS - one point to make, from this past year...
It is better to trade in the direction of the market, than to be the first to capture the trade in the other direction.
4.04.2010
4.03.2010
4.02.2010
Subscribe to:
Comments (Atom)


