12.30.2007

USO Chart


Here we are again, near 52week highs on the USO chart, and showing bearish divergence between price and MACD... The USO hit its top 4 times in 2006, before correcting (see chart)...So, we may be several weeks away, before the correction takes place..

The last correction in USO, was for a healthy 40% drop from August 2006 to Jan 2007, while the market rallied 20% during the same period.

tb

12.28.2007

VIX support @ 20 continues...


We broke 20, made it to 19. Then the VIX retested back to above 20. Now, it looks like it can continue to 22.5 before it falls again...

What we need is to see VIX below 19.. Thats when the bull market will really get going...

tb

12.27.2007

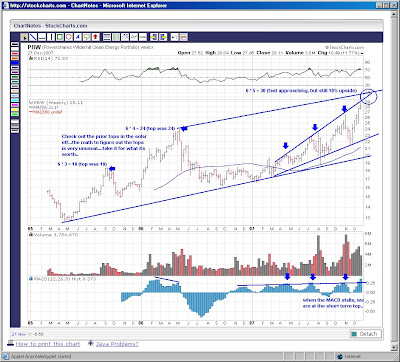
Solar ETF - PBW


Solars are running...yet, I noticed that with basic math, and a little technical analysis of support/resistance, you could project the next top in solars..

take a look...
tb

PXE Chart - Divergence in the making


PXE is a solar ETF, which is diverging... 3 MACD descending troughs is a very telling indicator...

12.26.2007

Retail Chart


Difficult to pick a single retail stock, but as a whole, the retailers will bounce soon... I am watching KSS..they don't report earnings until FEB..

12.23.2007

Merry Christmas!

I will be out much of the week...

I believe the break below the lower trendline in the VIX chart was significant on friday! So long as we continue below this trendline line, the market should move higher..Setting us up for a nice return in 2008!
Take care,
tb

PS- I think this short story below is a good reminder during the holiday season...


When things in your life seem almost too much to handle, when 24 hours in a day are not enough, remember the mayonnaise jar and two cups of coffee.

A professor stood before his philosophy class and had some items in front of him. When the class began, wordlessly, he picked up a very large and empty mayonnaise jar and proceeded to fill it with golf balls.

He then asked the students if the jar was full. They agreed it was.

The professor then picked up a box of pebbles and poured them into the jar. He shook the jar lightly. The pebbles rolled into the open areas between the golf balls.

He then asked the students if the jar was full. They agreed it was.

The professor next picked up a box of sand and poured it into the jar. Of course, the sand filled up everything else.

He asked once more if the jar was full. The students responded with a unanimous “yes”.

The professor then produced two cups of coffee from under the table and poured the liquid into the jar, effectively filling the empty space between the sand. The students laughed.

“Now,” said the professor, as the laughter subsided, “I want you to recognize that this jar represents your life. The golf balls are the important things – God, family, children, health, friends and favorite passions – things that if everything else was lost and only they remained, your life would still be full.

The pebbles are the other things that matter like your job, house and car. The sand is everything else – the small stuff.

“If you put the sand into the jar first” he continued, “There is no room for the pebbles or the golf balls. The same goes for life. If you spend all your time and energy on the small stuff, you will never have room for the things that are important to you.”

“So…Pay attention to the things that are critical to your happiness. Play with your children. Take time to get medical check-ups. Take your partner out to dinner. Play another 18. There will always be time to clean the house and fix the disposal. Take care of the golf balls first – the things that really matter. Set your priorities. The rest is just sand.”

One of the students raised her hand and inquired what the coffee represented. The professor smiled. “I’m glad you asked. It just goes to show you that no matter how full your life may seem, there’s always room for a couple of cups of coffee with a friend.”

12.20.2007

VIX support @ 20...break or bounce? (12.20.2007)


Deja vu?

RIMM Earnings.. Blow out Qtr!

ok, we are 2 for 2 now... First Oracle, now RIMM...

...again, "buy on the dips" took place today...

I was going to take a shot at the RIMM 110c's for $3...but, it just seemed too expensive, with only 1 day left to be right... stock is at $113 after hours..ahh well....

The game is to sell, sell, sell, after summer earnings season, and before the report of winter earnings season...

The market wants you to...
..focus on the fed...
..sell anything and everything..
..doom and gloom...

...then, just before winter earnings start coming in...
...you buy, buy, buy...forget all that news about write downs, recession noise..

..now its about companies, and their earnings report..and forecast..

Next big financial report is from..
Citigroup on JAN 15th..
JP Morgan is on JAN 16th...
Bank Of America is on JAN 22

Oil service report from...
SLB on JAN 18th..

CHIPS report...
INTC JAN 15th..
TXN JAN 22...

If we keep running higher from here, I would start protecting your profits near the JAN 15th week.. especially if we are at resistance right before they report..that would be a huge tell...

tb

PS - Did you get any ENER today? Up 10%! Check out my weekly chart, looks very good.

Weekly Chart - ENER

12.19.2007

Fed watch OVER.. Earnings watch BEGINS...

It time to focus on companies and earnings now...

Starting with Oracle...

47,000 call contracts went across today at the DEC 22.5 strike price for .10 to .15
22,000 call contracts went across today at the JAN 22.5 strike price for .30 to .40

in after hours, oracle is up 6% to 22ish..

Notice the trend the past few days? it's called, "buy the dips..."

Lets keep an eye on VIX at 20...

12.18.2007

IWM - Chart ...Re-Test support at 73..

VIX support @ 20...Reverse or break? >> Reverse


bounced off 20 (bearish), now reversing from 25 (bullish).

We have a falling MACD, which confirms the retracement back to 20...

GS Chart - Broken Cup n Handle


Looks like earnings expectations were priced in..

GS down 4.5% for the day..looks like it may head lower still...

12.17.2007

XLF at Open Interest support @ 29...

I want to post this before GS earnings, so I am not bias in my opinion...

Here is why XLF will close above 29 by friday...

There is to much open interest puts at 29 (38k calls vs 129k puts).

At $30 we are about even (106k vs 137k).
At $31 we are (120k vs 94k)
At $32 we are (124k vs 96k)
At $28 and below, its off the charts with puts to calls....

So, XLF can go to $31 by friday, but thats it, no more...

I wish I kept track of the open interest.. I was sure there was a ton more puts than calls, but now it appears its only the 29's and below that are heavy on the puts.

That said, those put options will expire worthless. So, XLF will most likely stay above $29, or will be a huge speculative buy below 29 this week.

This is where call options can go from $.05 to $2.50 in just a few days!

in other words...$50 investment can turn into $2500.

tb

BBH Chart - Biotech Holders


Alright Z,

Here is the BBH chart...It looks good at 160..But, we may be early..Cause, if market doesn't behave, we could head to 140...This is not based on fundamentals, but just based on plain ole charting of support/resistance..

Hope this helps..
tb

12.14.2007

Summary of Index's/ETF's for week of 12/10

XLF[29.35] bullish divergence forming, ahead of GS earnings, I like the chances of a rally..

SPY[147.17], bullish..right on 50dma support, pullback from prior 2 weeks..

XLE[76.45] neutral...has room to go (80?), but forming topping pattern...bearish divergence..

VIX[23.27], neutral..attempted 25, but mostly around 23..Below 20 is BULLISH, above 25 is BEARISH..anywhere in between is whip saw..

QQQQ[50.97], neutral..falling MACD again this week..one more down week, and we continue lower..48ish..

INDU[13339], bullish, pullback from prior 2 weeks..rising MACD still..

SMH[32.67], bullish, pullback from prior 2 weeks..rising MACD still..

EWZ[80], bearish, dbl top, falling MACD.. looks like lower still..

IWM[75], neutral.. falling MACD for 2nd week...one more down week, and we confirm down trend...68?

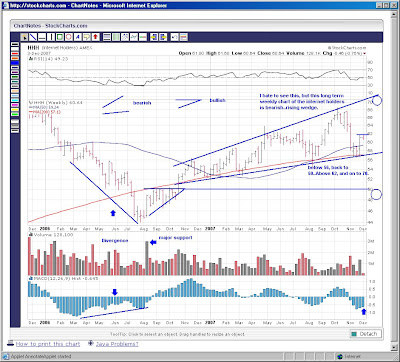
HHH[58.97], neutral..falling MACD this week, closed at 50dma..

SLX[83.32] bearish divergence, double top...looks like a fall from here...

GS Chart - Bullish Cup n Handle forming


This is an obvious cup and handle...which is a bullish chart formation..

If LEH earnings were not as bad as expected, what might GS earnings be?

Um, probably per usual, good. The chart says they will do just fine...

LEH - Bullish Chart...Really?


Whats going on here? I thought we were all short LEH?
After they reported it fell, just like the media wanted you to do...
But then, it rallied...and now it looks poised for a move higher...

Hmm, ahead of GS earnings, this stock actually looks pretty good...

12.12.2007

Dollar Chart - inflation measure

XLE - Bearish Chart


VIX @ 25...

I think we are indeed heading lower, if not now, soon...

XLE has too much weight on the SPY, and with degative divergence taking place..

12.11.2007

SPY Chart - for the weeks ahead...we got the pullback..now what?


Watch the VIX...should stay below 25....and eventually break below 20...

VIX above 25 and we head back to 30...

VIX support @ 20...break or bounce? >>Bounce


The chart says it all....we arrived at VIX 20..support trend line, and bounced..we could have a little more upside to 25..Which should fill the QQQQ gap @ $50.50...

VIX support @ 20...break or bounce?

GNSS - Chips are flying off the shelves!

12.10.2007

EBAY ready to run?


I own JAN 35 calls, and I almost sold them today, as it was not acting well in the midst of an up market. Having said that, I noticed that the selloff today was due to a gap that needed to be filled. Once, filled, it closed up 1%. Now, in after hours, its up a 3%.

I like the "potential" this stock has...

On the daily chart, 34 is resistance, which is the 200dma.

12.09.2007

QQQQ Daily Chart


We could head straight to $54, or we could fill the gap(s) first, then pursue $54 and beyond..

QQQQ Weekly Chart


So long as we hold above 48ish, we are in good shape to go higher...

12.07.2007

Divergence Abundance!

New trades...divergence...time to get in..time frame..2-3 months

ODP @ $17.40 has divergence, approaching zero line.click here

AA @ $36.50 has earnings JAN 8.click here

CELL @ $17.50 is ready to run.click here

WFR @ $80click here

VSE @ $14 has divergence.click here.

PSEM @ $18 has major break out.click here.

12.05.2007

Gap n' Go Market


Rush to get out, now rush to get in...

12.04.2007

AZO - Case study in Divergence


I am looking for the next AZO. If you have a stock or two that will report earnings over the next few weeks/months, and you want my technical analysis, send it my way!

Thanks, tb.

12.01.2007

Time to review the past 2 weeks...


This is very telling, as it represents both bulls and bears sentiment during the recent dow decline.

Lets keep this in the back of our mind the next time around!

11.29.2007

VIX dbl top approaching - pt2.1

Caution: SPY @142 within next 3 weeks.


Notice the HUGE interest in SPY 142 Puts!

I would suggest we use caution, tight stops, here..Huge GAP needs to fill eventually.

11.28.2007

JUST KIDDING....

Thats what the market said today... Just kidding....

Could that little fed news announement be timed any more perfect? An apparent double bottom in the indecies, a double top in the VIX..

You see, this market always pushes both bears and bulls to the extreme..

Watch the market at VIX 22...Its support for the VIX in an apparent bullish chart trend.

I saved comments and headlines from the past 2 weeks...very interesting...

11.21.2007

There is no "I" in team, but there is a "V" in bottom.

Did you sell everything this morning, ahead of the holiday's?

I like to watch other chat boards this time of year, and review their comments..Most bullish blogs were starting to post shorts, and were fearing the worst in the market, trying to make sense of all the noise (I mean news), while the bears were getting giddy with profits (using the news for the good reasons to be short)..

5 to 1 put to call ratio...man, if that isn't a contrarian indicator...

11.09.2007

XLF found support (for now)


If we can hold here, the target is around 33 where I put the circle.. Its a retracement of 38 - 50% from previous high.

CELL Chart


Tough market if you were long this week. I like the price action on this stock. A month ago someone bought 20,000 april call contracts! I am beginning to see why..

SEE my UNH chart...

UNH is running in this ugly market.

Also like DNA, CELL, RMBS, WFR.

11.08.2007

WFR Chart...


This solar stock is not extended (whatever that means) like the rest of 'em..

For example, difficult to buy and hold FSLR here after a $50 move!

11.07.2007

CSCO Priced to perfection..

DOW INDU - zero line on MACD


The ZERO Line is like "magic".

VIX dbl top approaching

WFR see's "PAR" in its crosshairs

Pull up a chart of WFR. Looks really good...

I still like DNA, UNH.

NEW stocks: ASD, CELL

Very busy right now, will try to post later..

11.02.2007

C or si?


This stock is stuck in downward spiral, that seems out of control. I know the financial sector is a terrible place to be right now, but that means the stocks are cheap. Perhaps, too cheap? Just look at the volume this week.

10.31.2007

Happy Holloween


Found some interesting charts that are poised to break to the upside.

10.30.2007

XOM - 5% correction in the making


By the looks of it, we look like we will drop to $85 very soon.

10.29.2007

USO - first warning signal


I suspect we break all time highs in USO, make headline news. Strong buy recommendations coming... That's the first warning (to take profits)...

10.28.2007

PXE, finds target approaching


If PXE makes new highs, buy them! Put a stop in at 23. The final stage of a move is typically the biggest move. HOWEVER, if we stall, we could find ourselves back to 21.