1.31.2008

Retail Chart - approaching resistance..


Is it time to start buying retail? The chart suggests we are near the end of the bounce...

tb

UPDATE: "Sell the earnings" continues.... this time, with GOOG..I see support at 490.

1.30.2008

VIX Daily chart..its going to MOVE SOON...


And the beat goes on, I firmly believe the VIX will reach 37ish before this year is up..

tb

1.29.2008

Which way? OI shows you the way...


You see the lack of puts in VMW? Thats the direction the market usually heads..Where the OI (open interest) is heavy, that is where resistance/support is at..

This also explains why a stock may go down a big percentage too.. Think about it..If there are few shorts in a stock, and the stock price is falling, then shorts come into the stock, selling it..More sellers than buyers, down she goes...When the sellers take profits a few days/weeks later, thats when the bounce will occur. Why? Because sellers have to buy to cover..

Watch the OI in puts..when this begins to decrease, the shorts are covering, and the stock price will start to recover..

tb

PS- I am looking for heavy calls to puts with earnings around the corner..

1.28.2008

Sell the earnings...buy the oversold dip...

Looks like the market is selling the earnings release, and buying, hours or days after the selloff...(ie., INTC, SPWR, VSEA) Could VMW be next?

So, whats been working in 2008?
Financials (BAC $33 to $41 int 1 week 1 day)
Homebuilders (DHI up over 50% from $10 bottom price)
Transportation (RAIL from $28 to $36)
Retail (AEO $17 to $23)

Whats correcting/consolidating?
Solars
Tech
Agriculture
Refiners
Semi's

Also, notice the weak 2007 stocks continued their selloff in 2008 for about the first two weeks of 2008, then almost on a dime, they have recovered in a big way...(RAIL, DAL, HD, TYC, WM, ODP, AEO).

Stocks putting in a bottom near 52week lows..
AMD
MU
SBUX
KSS
MCHP
MRVL
XJT


tb

1.26.2008

VIX Daily...Heading back to 32?


Watch the volatility index, if the market falls, the volatility should rise...As it approaches 32, it would be a good time to buy... The FOMC meeting this week may just the catalyst to push us back to 32..

tb

Update:
XLF, XHB due for pullbacks...

1.24.2008

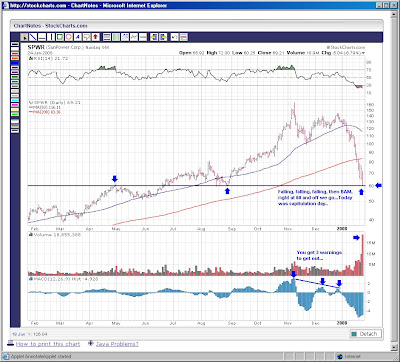
Target practice - SPWR


The news may be "bad" for SPWR, but the market reacted in a bullish way...

Reasons for bounce:
1) oversold conditions
2) capitulation like volume
3) bounce from solid support trendline
4) nice round number to bounce from ($60)

And if you are interested in SPWR's brother CY, they hit $19 today and bounced..Didn't Jeff Macke, the retail guy from "Fast Money", recommend buying CY at $30? 33% Discount just a few weeks later....

tb

1.23.2008

SPY weekly chart


Thought it would be good to revisit the SPY weekly chart, now that we have the VIX moving back in the bulls direction... I am taking this one swing trade at a time, and will not declare a bottom after today's reversal..

tb

ps- if you caught fast money tuesday, they read an email that asked, "I am tired of losing money, where should I put my money?". Answer: "Put it in SDS to protect against a market decline." Good advice, but bad timing. If she took that advice given yesterday and bought the SDS this morning, she would have paid $72/share, and SDS closed at $64/share. Timing is everything..

1.22.2008

VIX Pops and drops...


Ok, as projected, the VIX made a big move. You see, those VIX FEB call options were important...Increased VIX call buying without VIX price movement was the clue...

Now, after hitting 37, the VIX is retreating...Back to fill 21ish area would be a good entry to short/sell yet again...

tb

1.21.2008

VIX going to break above 30..

Did a double take, but the futures are down big right now...

"HONG KONG (MarketWatch) -- Asian markets were battered Monday, with fears the U.S. may slip into recession triggering heavy selling that dragged down the indexes in Japan, China, Hong Kong, India, South Korea and Singapore by at least 3%."

The volatility index continues to be my gauge on the market direction.. Based on futures right now, the triple top on the VIX will break to the upside. That break above 30 is bearish for the market. I continue to expect a pause from the market selling, but since the fed did not suprise on friday (like everyone wanted/expected), and the rising VIX chart is ready to break out, we can continue the selling...

tb

1.17.2008

VIX weekly chart - mov'n on up...


We are very close to a triple top...They say, triple bottoms never happen, they always break on the third attempt... I wonder if that is to be said for a triple tops? If that's the case, and we break the third attempt, then we are heading to 37. Which means, more selling still...

But having said that, we could easily take a pause from selling, and rally on some overdo fed cuts, and head back to 21.

The fact that open interest in the FEB puts is lighter than normal, is a concern.. All the puts covered this week.

tb

1.16.2008

VIX Daily chart..its going to MOVE SOON...


Remember, a rising VIX is bearish for the market, a falling VIX is bullish..

tb

1.15.2008

C retest lows at 26ish...

ok, so the up week might be defined as up 1 day, down the next...

Let's see, IBM see's growth, market rallies...WooHoo...
C reports bad numbers, writedowns, div cut...booo...

AAPL's keynote today...blah...
INTC reports earnings after the close..boo...

Update:
Intc missed by .02..down 12%

Tomorrow will be a down day, but I suspect, by either end of day tomorrow, or end of day thursday, we should be done selling for the week..

How do you create rocket fuel for the market?
Answer: sell stocks ahead of suprise announcement.

Update II:

per tk - "I was so convinced that I decided not to sit it out anymore, and in spite of the market being down hard, I entered two large index put positions: one on the $RUT (of course) and the other on the $NDX. These were somewhat risky plays. But my analysis was telling me, more strongly than ever, that the bears had tremendous strength on their side. It seems that it may work out for me after all."

tk is the ultimate contrarian..I am looking for a 10 year chart from his site. The last two times he posted a long term chart (5-10yrs), that was the (short term) market bottom... He posted a 2 year chart tonight, so we must be getting close...

tb

1.14.2008

The Chargers WIN!


As a long time Charger fan, it was great to see the underdog Chargers, win on the road against the Colts..An unbelievable win!

Oh...and as for the market...Well, MOS continues to amaze me... Sold off to 80 after earnings release, and now is 108! XLF Hammered last week, IWM bouncing, SMH rebounded, finally...PBW consolidating, VIX not at 20 yet, so the market has more room to go higher still..

I'm thinking, market goes up thru thursday, then Bernake speaks, no rate cut announcement, market sells off... Friday he announces suprise rate cut...Let's see what happens...

tb

1.12.2008

VIX options on the rise....


My weekly VIX chart from weeks ago shows a triple top at 30ish... The options activity for FEB 30's from friday confirms my target..

Having said that, I think we rally this week in anticipation of rate cut this week, but again, the fed will not do anything when he speaks thursday, thus another selloff thursday afternoon... Only to find he makes the 'surprise' announcement on friday.... this is options expiration week....

Did anyone notice the CFC move this past week?
You could have bought JAN 10's for pennies on tuesday, and sold them for $1 on wednesday afternoon...You need to be quick, but that is a huge return...for example, $100 could have returned $10,000..

With volatility on the rise...deep OTM options, both calls and puts are on the menu this week..

tb

1.11.2008

Sentiment...

I can't explain it, but even though we are down on the indicies, it feels like we are going higher today..

Stocks moving higer today:
MOS
POT
Solar's
DRYS

Comments from optionsdoggy.com:

CFC - JAN 2007 7.5p seller 20,000 @ 1.95 PHLX
C - Rumors of a 15$bill cash infusion

I grabbed deep out of the money calls in C.

If airlines can make 25% in 1 day, why not financials?

tb

1.10.2008

UAUA - Big move today..


By the option activity on 1/8, this was getting ready for a big move..

tb

MRVL...Is there something brewing?


Options activity suggest there is, albeit 1 year out..

1.09.2008

Bernanke speaks tomorrow..

We had a nice rally the last 2 hours of the day.. Bernanke is going to speak tomorrow, which 'spooked' the bears today.. Personally, I think anyone who had puts was out yesterday.. Let's see what tomorrow brings.. I do see some hammer's forming on several stocks...

tb

1.07.2008

PBW - Solar ETF Chart


I was really hoping for a clear cut signal at $30 before the solar correction happened..Based on my chart from 12/27, I was off by a $1...ah well..

Looks like a good opportunity to get in, with a tight stop below the 50dma..

tb

1.05.2008

VIX Daily chart..resistance line broken..


I've been watching the VIX for months, as to what direction the market is headed..
Remember, when the VIX is rising, the market is falling...

The bulls would all feel much better if the VIX was below 20-19 area..That would break the up trending chart...But, right now, it looks more like we are headed higher.. And from the looks of it, we could be in for more pain as the VIX looks like its headed for 27-30 area..

The divergence on the VIX is significant if we make it back to 27-30 area, as each time it hit 27-30 before, (AUG and NOV), the MACD has been falling..That just means the VIX is weaking as it approaches the 27-30 area...That's another way to say the bears are becoming more and more tired...

Check out the USO chart in my archives...Its telling on what happend next...

tb

SPY Daily chart - lower trendline met..


Ok, this would be a very nice spot to bounce from, don't you think? To keep us range bound for just a bit longer...

1.04.2008

Economic data out...

Now that the "bad" data is out, whats next?

How about earnings season, Mac World, tech conventions...

Some observations today...

AAPL filled gap at 188..
RIMM filled gap at 107..
RTH fell into the support area at 86-87 area...
VIX gapped up this week..
INTC fell back to support..earnings in 2 weeks..

tb

1.03.2008

RTH Chart - Looking for support, not finding any..


I took a shot on BBBY puts today, as the RTH broke down, along with an earnings report from BBBY after hours, I thought now is the right time to get into puts..

After hours, BBBY is down 10% to 25.50. I paid, $1 for the puts, if the AH price holds, should be worth $3. Nice 200% return in just 2 days!

I am looking for other retailers, with earnings dates..If you have any on the radar, let me know.. thanks!